Extreme Value Estimation of Non-Gaussian Wind Load: Empirical Formula of HPM-based Translation Process
-
摘要:
风荷载极值概率信息对于结构抗风可靠性设计十分重要, 基于Hermite多项式模型(Hermite polynomial model, HPM)转换过程方法由于在估计强非高斯性风荷载极值方面表现优异, 因而受到研究人员的青睐从而被广泛应用。另一方面, 该方法的使用过程烦琐且有较强的理论性, 不利于工程应用。为此, 该文基于该方法提出非高斯风荷载极值估计的经验公式, 首先系统地阐述基于HPM转换过程方法, 接着对风荷载的极值分布函数模型展开讨论, 之后通过回归分析提出风荷载极值分布函数的经验公式, 并对其适用性和精确性加以验证。研究成果表明, 仅需知晓风荷载若干统计特征的情况下, 经验公式可快速估计风荷载极值, 精度上与HPM转换过程方法基本相同, 而在效率和便捷性方面显著提升, 便于在工程中推广使用。
Abstract:Knowing the probability information of extreme wind load is important for reliability-based structural wind resistance design. The Hermite polynomial model (HPM)-based translation process method performs well in estimating extreme value of strongly non-Gaussian wind load. It has been favored by researchers and widely used. On the other hand, using this method is relatively complicated and highly theoretical, which is not conducive to engineering application. Therefore, based on this method, this paper proposes an empirical formula for estimating the extreme value of non-Gaussian wind load. In this paper, the HPM-based translation process method was first presented systematically. The distribution model of extreme wind load was then discussed. Afterward the empirical formula of extreme value distribution of wind load was proposed through the regression analysis. The applicability and accuracy of the formula were also verified. The research shows that the extreme value of wind load can be quickly estimated by the empirical formula only with knowledge of limited statistics of wind load. The accuracy is the same as the prototype method, however, the efficiency and convenience are significantly improved, which makes it easy to promote the use of the method in engineering application.
-
保证建筑结构在台风等强风环境中的安全十分重要[1-2],研究人员通常需获悉风荷载极值的概率信息以期实现结构抗风的可靠性设计。早期,Davenport[3]假设风荷载时程遵从高斯随机过程,基于高斯过程极值分布提出了著名的峰值因子法,计算风荷载极值的期望。许多研究发现,处于气流分离区的结构表面风压往往呈现非高斯性[4],利用Davenport的峰值因子法会低估风荷载极值[5]。为解决这一问题,业内学者开展了针对非高斯风荷载的极值估计方法研究。
目前,非高斯风荷载的极值估计方法大致可以归纳为2类:
1) 峰值观测法。通过提取风荷载时程全局或局部峰值的独立观测样本,经统计分析出风荷载极值的期望或概率分布,如直接法[6]、Gumbel转换法[7]、POT法[8]和独立风暴法[9]等。
2) 转换过程法。通过建立非高斯风荷载过程与标准高斯过程的映射关系,结合高斯过程极值分布得到风荷载极值的期望或概率分布。根据映射函数性质的不同,转换过程方法分为隐式转换过程和显式转换过程,前者利用风荷载母分布与标准高斯分布的等概率原则求极值,其中常用母分布有三参数Gamma分布[10]、非参数Kernel分布[11]和混合分布[12]等,后者提供了非高斯过程与高斯过程关系的显化关系式,常见模型包括Hermite多项式模型(Hermite polynomial model,HPM)[13]和Johnson转换模型[14]。
从效果上看,峰值观测法基于有限观测样本得到的结果往往不确定性较强[15],相比之下,转换过程法充分调用整体时程信息,其中,基于HPM转换过程方法在估计风荷载极值时的精确性和便利性方面表现出众,得到普遍认可以及广泛应用[16-17]。Kareem等[18]将Winterstein等[19]的HPM转换函数与Davenport[3]峰值因子法相融合,提出非高斯峰值因子法。之后,许多学者对该方法在精度、效率和适用性等方面进行深入研究和优化。Kown等[20]对文献[18]中HPM系数的矩法估计进行修正,从而提高风荷载极值的计算精度。Yang等[21]在原适用条件下,给出非适用条件下对于矩的近似处理办法,进一步拓展该方法的应用范围。Liu等[22]引入新的统计矩定义,不仅提高风荷载极值的计算精度,而且大幅度提升Hermite模型对实际问题的适用性。Huang等[23]则在基于HPM转换过程基础上,提出风荷载极值分布参数的经验公式,提高了问题求解效率。此外,Huang等[24]基于4组风洞实验数据,引入HPM参数的经验修正公式,进一步改善了风荷载极值估计的精度。
尽管基于HPM转换过程方法估计风荷载极值受到普遍认可,但其在使用过程中包含参数求解、公式拟合等烦琐步骤,阻碍其在工程上推广使用,因此有必要发展更加方便快捷且直观易懂的风荷载极值估计方法。为此,本文以该方法为基础开展研究,首先,系统阐述基于HPM转换过程方法,并讨论风荷载极值的分布函数模型;之后,基于讨论结果,提出极值分布函数参数的新经验公式,并开展误差分析;最后,给出相关结论。
1. 风荷载极值分布函数估计
1.1 基于HPM的转换过程方法
非高斯过程根据其峰度大小分为硬化过程和软化过程,对风荷载而言,软化过程最为常见,本文关注软化过程的极值求解。假设X(t)为软化非高斯过程,其均值、标准差、偏度和峰度分别表示为r1、r2、r3和r4,对X(t)进行归一化处理得到Y(t)=[X(t)-r1]/r2。令U(t)表示标准高斯过程,通过HPM可将Y(t)与U(t)关联起来[19],即
$$ Y=g(U)=\kappa\left[U+h_3\left(U^2-1\right)+h_4\left(U^3-3 U\right)\right] $$ (1) 式中κ、h3、h4为HPM的形状参数。利用矩估计,可建立非线性方程组
$$ \left\{\begin{aligned} r_3= & \kappa^3\left(6 h_3+36 h_3 h_4+8 h_3^3+108 h_3 h_4^3\right) \\ r_4= & \kappa^4\left(3+24 h_4+60 h_3^2+252 h_4^2+576 h_3^2 h_4+\right. \\ & \left.1\;296 h_4^3+60 h_3^4+2\;232 h_3^2 h_4^2+3\;348 h_4^4\right) \end{aligned}\right. $$ (2) 式中
$$ 1=\kappa^{2}\left(1+2 h_{3}^{2}+6 h_{4}^{2}\right) $$ 在知晓偏度和峰度前提下,可通过Newton-Raphson迭代求解HPM形状参数。
U(t)与Y(t)需满足一一映射关系,即要求g(U)单调递增,所以h3和h4需要满足条件
$$ h_{3}^{2}+3 h_{4}\left(3 h_{4}-1\right) \leqslant 0 $$ (3) 同时,式(3)规定偏度、峰度取值的有效区域。由此,可得到HPM逆变换关系
$$ \begin{gather*} U=g^{-1}(Y)=\left[\sqrt{\zeta^{2}(Y)+c}+\zeta(Y)\right]^{1 / 3}- \\ {\left[\sqrt{\zeta^{2}(Y)+c}-\zeta(Y)\right]^{1 / 3}-a} \end{gather*} $$ (4) 式中
$$ \begin{gathered} \zeta(y)=1.5 b(a+Y / \kappa)-a^{3} \\ a=h_{3} /\left(3 h_{4}\right) \\ b=1 /\left(3 h_{4}\right) \\ c=\left(b-1-a^{2}\right)^{3} \end{gathered} $$ Y(t)的概率密度函数则可写成
$$ \begin{equation*} f_{Y}(Y)=\frac{1}{\sqrt{2 {\mathsf{π}}}} \exp \left(-\frac{\left[g^{-1}(Y)\right]^{2}}{2}\right) \frac{\mathrm{d} g^{-1}(Y)}{\mathrm{d} Y} \end{equation*} $$ (5) 对于标准高斯过程U(t),Rice[25]给出其极值的概率分布表达式
$$ \begin{equation*} F_{U_{\mathrm{pk}}}\left(U_{\mathrm{pk}}\right)=\exp \left[-\lambda \exp \left(-\frac{U_{\mathrm{pk}}^{2}}{2}\right)\right] \end{equation*} $$ (6) 式中:λ=v0T为过程U(t)的平均穿零数,其中v0为平均穿零率,T为时距;Upk为高斯极值。v0计算公式为
$$ \begin{equation*} v_{0} \approx \sqrt{\int_{0}^{\infty} \omega^{2} S_{Y}(\omega) \mathrm{d} \omega} \end{equation*} $$ (7) 式中:ω为频率,rad/s;SY(ω)为Y(t)的单边功率谱密度,且有$\int_0^{\infty} S_Y(\omega) \mathrm{d} \omega=1$。
基于HPM所建立的转换关系,非高斯过程Y(t)极值的概率分布可表示为
$$ \begin{equation*} F_{Y_{\mathrm{pk}}}\left(Y_{\mathrm{pk}}\right)=\exp \left\{-\lambda \exp \left\{-\frac{\left[g^{-1}\left(Y_{\mathrm{pk}}\right)\right]^{2}}{2}\right\}\right\} \end{equation*} $$ (8) 由式(8)可以导出q分位点极值
$$ \begin{equation*} Y_{\mathrm{pk}, q}=g(\sqrt{2(\ln \lambda+{\mathit{\Omega}})}) \end{equation*} $$ (9) 式中Ω=-ln(-ln q)。当q=0.57时,可得到非高斯过程的峰值因子。此外,原始过程X(t)的极值分布函数或分位点极值,可根据关系Y=(X-r1)/r2得到相应表达式。
1.2 极值分布函数
在基于可靠度或风险的结构抗风设计中,通常将风荷载极值表示为特定的概率分布函数,以获取设计重现期下的风荷载值[19]。依据经典极值理论,可认为风荷载极值服从广义极值分布。据此,可将式(8)拟合成广义极值(generalized extreme value,GEV)分布,即
$$ \begin{equation*} F_{Y_{\mathrm{pk}}}\left(Y_{\mathrm{pk}}\right)=\exp \left[-\left(1-k \frac{Y_{\mathrm{pk}}-\mu}{\sigma}\right)^{\frac{1}{k}}\right] \end{equation*} $$ (10) 式中μ、σ和k分别表示位置参数、尺度参数和形状参数。相应地,q分位点极值为
$$ \begin{equation*} Y_{\mathrm{pk}, q}=\mu+\frac{\sigma}{k}[1-\exp (-k {\mathit{\Omega}})] \end{equation*} $$ (11) 此外,为了方便起见,众多研究中将风荷载极值拟合成极值Ⅰ型分布,又称Gumbel(GUM)分布,即
$$ \begin{equation*} F_{Y_{\mathrm{pk}}}\left(Y_{\mathrm{pk}}\right)=\exp \left[-\exp \left(-\frac{Y_{\mathrm{pk}}-\mu}{\sigma}\right)\right] \end{equation*} $$ (12) 此时,q分位点极值为
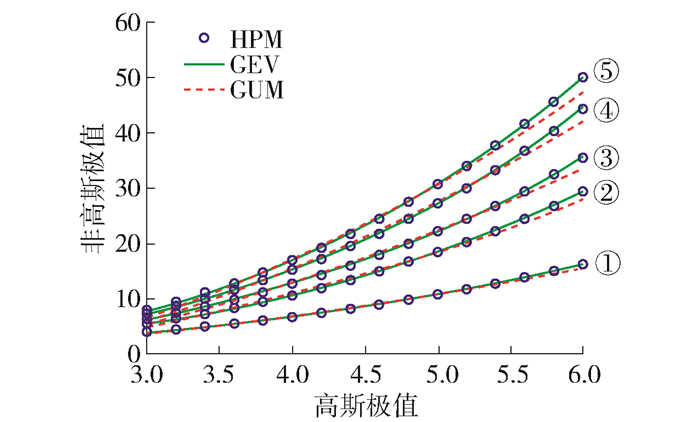
$$ \begin{equation*} Y_{\mathrm{pk}, q}=\mu+\sigma {\mathit{\Omega}} \end{equation*} $$ (13) 为了探讨GEV分布和GUM分布与HPM的匹配度,选定5种偏度峰度组合:
① (r3, r4)=(0, 5);
② (r3, r4)=(1, 10);
③ (r3, r4)=(2, 25);
④ (r3, r4)=(3, 30);
⑤ (r3, r4)=(4, 35)。
①~⑤对应着风荷载非高斯性由弱到强。图 1展示λ=3 000时,5组偏度峰度下2种分布函数的拟合效果。可以看到,广义极值分布的拟合精度非常高,然而GUM分布关于HPM的拟合则存在明显的偏差,尤其是当求强非高斯风荷载高分位点极值时误差明显。
为了更全面展示2种分布函数与HPM的匹配度,采用均方根误差(root mean square error,RMSE)用于评判拟合效果,表达式为
$$ \begin{equation*} e_{\mathrm{RMSE}}=\sqrt{E\left[\left(Y_{\mathrm{pk}, q}^{*}-Y_{\mathrm{pk}, q}^{\#}\right)^{2}\right]} \end{equation*} $$ (14) 式中:Ypk, q*为式(10)求出的q分位点极值;Ypk, q#为式(11)或(13)求出的q分位点极值;E[·]表示期望运算。计算均方根误差时,应视q为服从标准均匀分布的随机变量。
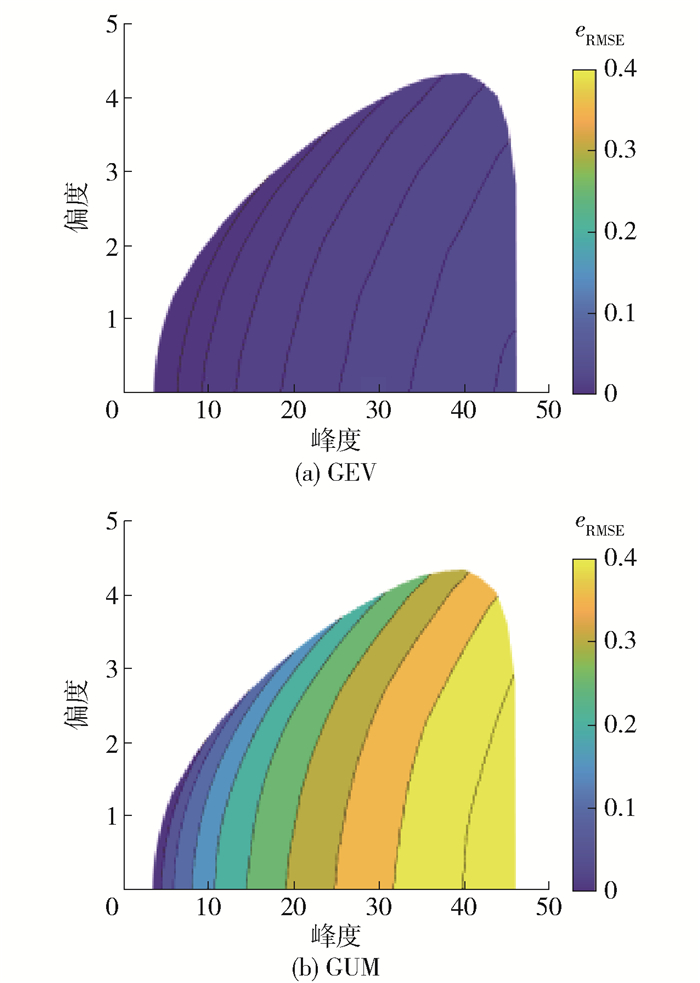
图 2统计了当λ=3 000时,在偏度峰度有效区域内,GEV分布和GUM分布拟合结果的均方根误差。观察发现,GEV分布拟合误差无论非高斯性强弱均控制在5%以下,其与HPM的匹配度良好,然而GUM分布拟合误差基本上高于10%,且非高斯性较强时,误差可达40%以上。分析发现,式(9)和(11)中的Ypk, q与Ω均呈非线性关系,GEV分布通过调节3个参数可使其匹配式(10)所绘的非线性关系;然而,式(14)中Ypk, q与Ω呈线性关系,故而GUM分布无法匹配式(9)的非线性关系,从而造成极值分析结果的误差。因此,在基于转换过程法求解风荷载极值时,从提高精确度从发,应首选GEV分布表示其分布函数。
2. 风荷载极值分布参数经验公式
尽管利用三参数GEV分布模型表示基于HPM转换过程风荷载极值分布函数可以降低GUM模型误差,但在运作中参数求解、函数拟合等步骤极大地影响了求解效率,尤其在社区风灾模拟中,大量房屋构件的分析需求会导致效率十分低下。
观察发现,在风荷载极值估计过程中,求解极值分布参数仅需用到风荷载的偏度、峰度以及平均穿零数3个统计参数。因此,可建立2组参数之间的直接关系式。Huang等[23]给出GUM分布两参数的求解经验公式,极大提高了分析效率。类似地,可以提出GEV分布三参数的经验公式,即在保证精确度的前提下,进一步提高分析效率。
2.1 适用范围
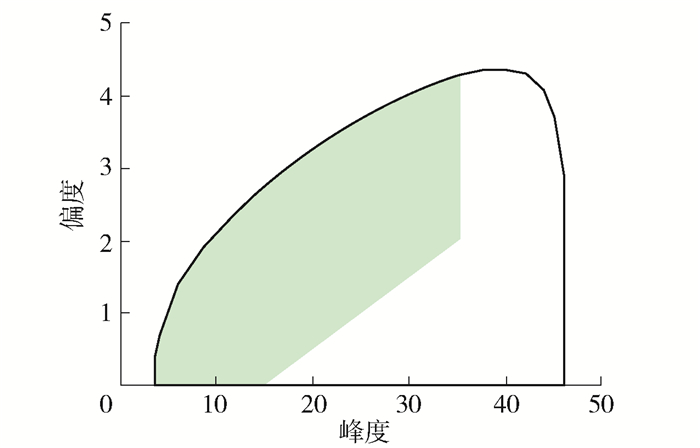
Huang等[23]基于对有限试验数据的研究,认为风荷载的偏度、峰度集中于某一固定区域(图 3中绿色区域),故所提经验公式适用于有限范围的偏度峰度组合。本文拟合得到的经验公式覆盖HPM偏度峰度有效区域的整个正偏度部分(图 3实线包围区域),可以提高经验公式的适用性。
对于平均穿零数的范围,需考虑平均穿零率和时距2个方面。普遍认为,工程中风荷载等常见随机激励的平均穿零率不超过10[23],且荷载规范采用的时距通常从10 min[26]到1 h[27]不等,故选取600~36 000作为经验公式平均穿零数的适用范围,可以涵盖绝大多数的实际应用场景。
2.2 经验公式
建立经验公式步骤大致如下:首先,对输入参数(偏度、峰度和平均穿零数)在各自适用范围内进行充分采样,得到涵盖有效范围的取值组合; 其次,对所有输入参数组合,采用基于HPM转换过程方法进行极值估计,可以得到相应的GEV分布参数,图 4展示了输入参数和输出参数的对应关系;最后,对2组参数开展多元线性回归分析,得到关于GEV分布函数参数的经验公式
$$ \mu=\boldsymbol{r}_3\left(\boldsymbol{P}_\mu^{(1)}+\boldsymbol{P}_\mu^{(2)} \sqrt{\ln \lambda}+\boldsymbol{P}_\mu^{(3)} \ln \lambda\right) \tilde{\boldsymbol{r}}_4^{\mathrm{T}} $$ (15) $$ \sigma=\boldsymbol{r}_3\left(\boldsymbol{P}_\sigma^{(1)}+\boldsymbol{P}_\sigma^{(2)} \sqrt{\ln \lambda}+\boldsymbol{P}_\sigma^{(3)} \ln \lambda\right) \tilde{\boldsymbol{r}}_4^{\mathrm{T}} $$ (16) $$ k=\frac{\boldsymbol{r}_3\left(\boldsymbol{P}_k^{(1)}+\boldsymbol{P}_k^{(2)} \sqrt{\ln \lambda}+\boldsymbol{P}_k^{(3)} \ln \lambda\right) \tilde{\boldsymbol{r}}_4^{\mathrm{T}}}{\boldsymbol{A} \tilde{\boldsymbol{r}}_4^{\mathrm{T}}} $$ (17) 式中:r3=[1, r3, r32, r33];${\widetilde {\mathit{\boldsymbol{r}}}_4}$=[1, r4, r42, r43],其中${\widetilde r_4}$=ln r4-ln3;A=[0.4 1 1 1];PΔ(j)为经验公式系数矩阵(Δ=μ, σ, k;j=1, 2, 3),具体数值详见表 1。通过经验公式,在知晓非高斯过程的偏度、峰度和平均穿零数的前提下,可以十分快速地估计该过程的极值分布函数或任一分位点极值。
表 1 经验公式系数矩阵PΔ(j)Table 1. Coefficient matrix of empirical formula PΔ(j)Δ j 1 2 3 μ $\left[\begin{array}{cccc}0.194\; 4 & 6.754\; 4 & -0.372\; 7 & 0.130\; 5 \\ 0.122\; 7 & 1.669\; 6 & -2.925\; 1 & 0.856\; 3 \\ -3.768\; 0 & 5.531\; 9 & -1.605\; 0 & 0.015\; 1 \\ -1.274\; 8 & 0.473\; 1 & 0 & 0\end{array}\right]$ $\left[\begin{array}{cccc}1.199\; 8 & -7.381\; 7 & 0.469\; 4 & -0.169\; 8 \\ -0.272\; 6 & -1.684\; 5 & 2.979\; 2 & -0.870\; 0 \\ 3.995\; 0 & -5.746\; 5 & 1.674\; 1 & -0.022\; 1 \\ 1.278\; 0 & -0.474\; 6 & 0 & 0\end{array}\right]$ $\left[\begin{array}{cccc}0.072\; 5 & 2.401\; 5 & -0.200\; 8 & 0.064\; 1 \\ 0.359\; 3 & 0.343\; 9 & -0.762\; 5 & 0.225\; 8 \\ -1.183\; 3 & 1.622\; 8 & -0.478\; 9 & 0.011\; 1 \\ -0.328\; 6 & 0.122\; 3 & 0 & 0\end{array}\right]$ σ $\left[\begin{array}{cccc}0.727\; 2 & -0.206\; 6 & -0.006\; 4 & -0.002\; 4 \\ 0.241\; 7 & -0.196\; 0 & 0.235\; 9 & -0.068\; 2 \\ 0.222\; 9 & -0.394\; 7 & 0.117\; 5 & 0 \\ 0.108\; 6 & -0.040\; 2 & 0 & 0\end{array}\right]$ $\left[\begin{array}{cccc}-0.228\; 8 & 0.471\; 0 & -0.033\; 8 & 0.012\; 6 \\ -0.001\; 6 & 0.144\; 6 & -0.204\; 6 & 0.056\; 8 \\ -0.243\; 8 & 0.337\; 9 & -0.093\; 8 & 0 \\ -0.075\; 4 & 0.028\; 0 & 0 & 0\end{array}\right]$ $\left[\begin{array}{cccc}0.027\; 7 & -0.009\; 0 & 0.001\; 8 & -0.000\; 6 \\ 0.000\; 8 & -0.003\; 8 & 0.003\; 1 & -0.000\; 7 \\ 0.003\; 5 & -0.003\; 4 & 0.000\; 8 & 0 \\ 0.000\; 4 & -0.000\; 1 & 0 & 0\end{array}\right]$ k $\left[\begin{array}{cccc}0.118\; 5 & -0.273\; 0 & 0.125\; 5 & -0.362\; 9 \\ -0.092\; 8 & 0.061\; 3 & 0.097\; 6 & 0 \\ 0.183\; 4 & -0.176\; 6 & 0 & 0 \\ 0.052\; 7 & 0 & 0 & 0\end{array}\right]$ $\left[\begin{array}{cccc}-0.058\; 1 & 0.092\; 6 & -0.065\; 0 & 0.156\; 6 \\ 0.049\; 0 & -0.048\; 7 & -0.033\; 8 & 0 \\ -0.069\; 8 & 0.069\; 1 & 0 & 0 \\ -0.021\; 9 & 0 & 0 & 0\end{array}\right]$ $\left[\begin{array}{cccc}0.007\; 5 & -0.009\; 3 & 0.009\; 0 & -0.019\; 3 \\ -0.006\; 6 & 0.007\; 3 & 0.003\; 6 & 0 \\ 0.007\; 8 & -0.007\; 8 & 0 & 0 \\ 0.002\; 6 & 0 & 0 & 0\end{array}\right]$ 2.3 精度验证
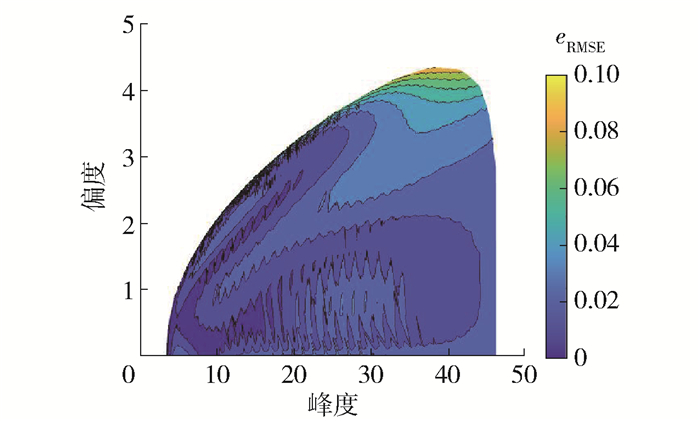
为了检验经验公式,通过式(14)计算其拟合HPM的均方根误差,式中Ypk, q#对应由经验公式计算的分位点极值。图 5展示了各偏度峰度组合下对应平均穿零数取600~36 000时的误差最大值,发现整体误差均在8%以内,接近图 2(a)中的结果,说明经验公式对极值分布的拟合效果良好。
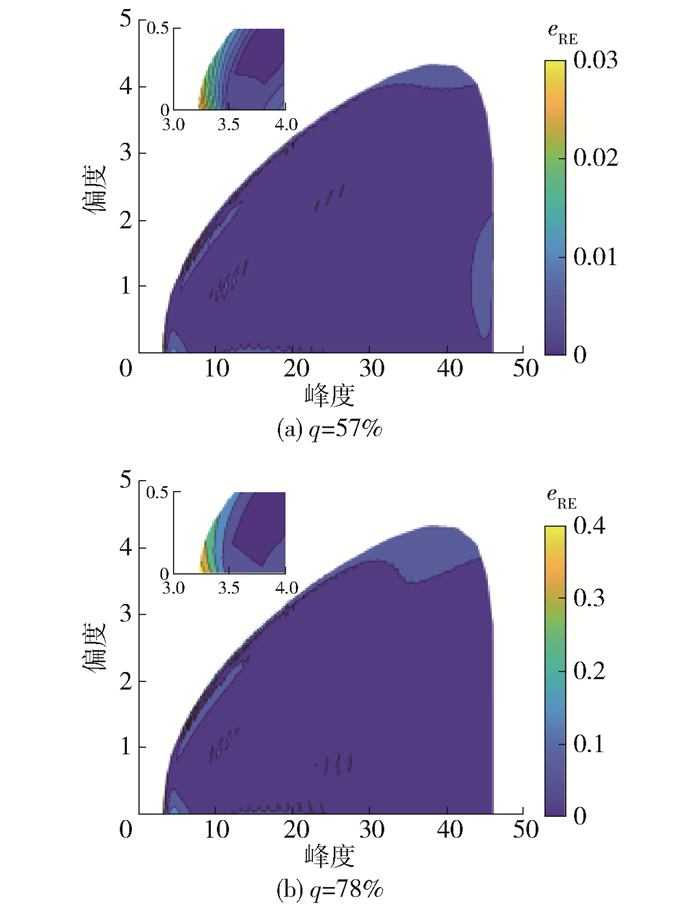
此外,结构抗风设计中常考虑57%和78%分位点极值[24],因此进一步检验经验公式关于2个分位点极值的估计效果十分必要。采用相对误差计算公式
$$ \begin{equation*} e_{\mathrm{RE}}=\frac{\left|Y_{\mathrm{pk}, q}^{*}-Y_{\mathrm{pk}, q}^{\#}\right|}{Y_{\mathrm{pk}, q}^{*}} \end{equation*} $$ (18) 对于在有效区域内,图 6分别给出平均穿零数600~36 000、分位点分别为57%和78%时的极值相对误差的最大值,从图中可以看出在各偏度峰度组合下相对误差基本低于1%,且最大值不会超过3%,进一步说明经验公式对于极值的估计效果良好,可有效替代原HPM用于极值估计中。
3. 结论
基于HPM转换过程方法被广泛应用于非高斯风荷载的极值估计中,本研究在该方法基础上进一步发展了极值估计的经验公式。主要结论如下:
1) GEV分布可描述高斯与非高斯极值的强非线性关系,因此其在模型层面与HPM的匹配度更好,而GUM分布在求解强非高斯风荷载高分位点极值存在较大误差。
2) 在知晓风荷载偏度、峰度以及平均穿零数的前提下,通过经验公式可快速求解GEV分布参数,进而估计风荷载极值分布以及任一分位点极值。
3) 经验公式与基于HPM转换过程方法在极值估计的精度上相差无几,前者不仅在效率上优势明显,且直观易懂,这将极大地方便工程应用。
-
表 1 经验公式系数矩阵PΔ(j)
Table 1 Coefficient matrix of empirical formula PΔ(j)
Δ j 1 2 3 μ $\left[\begin{array}{cccc}0.194\; 4 & 6.754\; 4 & -0.372\; 7 & 0.130\; 5 \\ 0.122\; 7 & 1.669\; 6 & -2.925\; 1 & 0.856\; 3 \\ -3.768\; 0 & 5.531\; 9 & -1.605\; 0 & 0.015\; 1 \\ -1.274\; 8 & 0.473\; 1 & 0 & 0\end{array}\right]$ $\left[\begin{array}{cccc}1.199\; 8 & -7.381\; 7 & 0.469\; 4 & -0.169\; 8 \\ -0.272\; 6 & -1.684\; 5 & 2.979\; 2 & -0.870\; 0 \\ 3.995\; 0 & -5.746\; 5 & 1.674\; 1 & -0.022\; 1 \\ 1.278\; 0 & -0.474\; 6 & 0 & 0\end{array}\right]$ $\left[\begin{array}{cccc}0.072\; 5 & 2.401\; 5 & -0.200\; 8 & 0.064\; 1 \\ 0.359\; 3 & 0.343\; 9 & -0.762\; 5 & 0.225\; 8 \\ -1.183\; 3 & 1.622\; 8 & -0.478\; 9 & 0.011\; 1 \\ -0.328\; 6 & 0.122\; 3 & 0 & 0\end{array}\right]$ σ $\left[\begin{array}{cccc}0.727\; 2 & -0.206\; 6 & -0.006\; 4 & -0.002\; 4 \\ 0.241\; 7 & -0.196\; 0 & 0.235\; 9 & -0.068\; 2 \\ 0.222\; 9 & -0.394\; 7 & 0.117\; 5 & 0 \\ 0.108\; 6 & -0.040\; 2 & 0 & 0\end{array}\right]$ $\left[\begin{array}{cccc}-0.228\; 8 & 0.471\; 0 & -0.033\; 8 & 0.012\; 6 \\ -0.001\; 6 & 0.144\; 6 & -0.204\; 6 & 0.056\; 8 \\ -0.243\; 8 & 0.337\; 9 & -0.093\; 8 & 0 \\ -0.075\; 4 & 0.028\; 0 & 0 & 0\end{array}\right]$ $\left[\begin{array}{cccc}0.027\; 7 & -0.009\; 0 & 0.001\; 8 & -0.000\; 6 \\ 0.000\; 8 & -0.003\; 8 & 0.003\; 1 & -0.000\; 7 \\ 0.003\; 5 & -0.003\; 4 & 0.000\; 8 & 0 \\ 0.000\; 4 & -0.000\; 1 & 0 & 0\end{array}\right]$ k $\left[\begin{array}{cccc}0.118\; 5 & -0.273\; 0 & 0.125\; 5 & -0.362\; 9 \\ -0.092\; 8 & 0.061\; 3 & 0.097\; 6 & 0 \\ 0.183\; 4 & -0.176\; 6 & 0 & 0 \\ 0.052\; 7 & 0 & 0 & 0\end{array}\right]$ $\left[\begin{array}{cccc}-0.058\; 1 & 0.092\; 6 & -0.065\; 0 & 0.156\; 6 \\ 0.049\; 0 & -0.048\; 7 & -0.033\; 8 & 0 \\ -0.069\; 8 & 0.069\; 1 & 0 & 0 \\ -0.021\; 9 & 0 & 0 & 0\end{array}\right]$ $\left[\begin{array}{cccc}0.007\; 5 & -0.009\; 3 & 0.009\; 0 & -0.019\; 3 \\ -0.006\; 6 & 0.007\; 3 & 0.003\; 6 & 0 \\ 0.007\; 8 & -0.007\; 8 & 0 & 0 \\ 0.002\; 6 & 0 & 0 & 0\end{array}\right]$ -
[1] 吴延峰, 苏经宇, 王志涛, 等. 建筑物风荷载环境数值模拟研究[J]. 北京工业大学学报, 2009, 35(1): 84-88. https://journal.bjut.edu.cn/bjgydxxb/cn/article/id/de3bad4a-a84b-44de-a9ea-107b1f6d6e11 WU Y F, SU J Y, WANG Z T, et al. Research on numerical simulation of building under wind load environment [J]. Journal of Beijing University of Technology, 2009, 35(1): 84-88. (in Chinese) https://journal.bjut.edu.cn/bjgydxxb/cn/article/id/de3bad4a-a84b-44de-a9ea-107b1f6d6e11
[2] 孙晓峰, 曾坚, 周传璐, 等. 台风灾害对琼北地区城市建设的影响——以海口某不规则超高层建筑的数值模拟分析为例[J]. 北京工业大学学报, 2012, 38(6): 840-846. https://journal.bjut.edu.cn/bjgydxxb/cn/article/id/0dcaebb2-8c85-4276-9b99-864ddc2065de SUN X F, ZENG J, ZHOU C L, et al. Effects of typhoon disasters on urban constructions in northern area of hainan—in the case of the numerical simulation analysis of an irregular high-rise building in haikou[J]. Journal of Beijing University of Technology, 2012, 38(6): 840-846. (in Chinese) https://journal.bjut.edu.cn/bjgydxxb/cn/article/id/0dcaebb2-8c85-4276-9b99-864ddc2065de
[3] DAVENPORT A G. Note on the distribution of the largest value of a random function with applications to gust loading [J]. Proceedings of the Institution of Civil Engineers, 1964, 28(2): 187-196. doi: 10.1680/iicep.1964.10112
[4] GIOFFRE M. Wind-induced peak bending moments in low-rise building frames [J]. Journal of Engineering Mechanics, 2000, 126(8): 879-881. doi: 10.1061/(ASCE)0733-9399(2000)126:8(879)
[5] HUANG G Q, LUO Y, GURLEY K R, et al. Revisiting moment-based characterization for wind pressures [J]. Journal of Wind Engineering and Industrial Aerodynamics, 2016, 151: 158-168. doi: 10.1016/j.jweia.2016.02.006
[6] STATHOPOULOS T. Turbulent wind action on low rise buildings[D]. London, Ontario, Canada: University of Western Ontario, 1979.
[7] KASPERSKI M. Specification of the design wind load based on wind tunnel experiments [J]. Journal of Wind Engineering and Industrial Aerodynamics, 2003, 91(4): 527-541. doi: 10.1016/S0167-6105(02)00407-5
[8] SIMIU E, HECKERT N A. Extreme wind distribution tails: a "peaks over threshold" approach [J]. Journal of structural engineering, 1996, 122(5): 539-547. doi: 10.1061/(ASCE)0733-9445(1996)122:5(539)
[9] HARRIS R I. XIMIS, a penultimate extreme value method suitable for all types of wind climate [J]. Journal of Wind Engineering and Industrial Aerodynamics, 2009, 97(5/6): 271-286.
[10] SADEK F, SIMIU E. Peak non-Gaussian wind effects for database-assisted low-rise building design [J]. Journal of Engineering Mechanics, 2002, 128(5): 530-539. doi: 10.1061/(ASCE)0733-9399(2002)128:5(530)
[11] HUANG M F, LOU W, CHAN C M, et al. Peak distributions and peak factors of wind-induced pressure processes on tall buildings [J]. Journal of Engineering Mechanics, 2013, 139(12): 1744-1756.
[12] DING J, CHEN X Z. Assessment of methods for extreme value analysis of non-Gaussian wind effects with short-term time history samples [J]. Engineering Structures, 2014, 80: 75-88. doi: 10.1016/j.engstruct.2014.08.041
[13] MA X L, XU F Y. Peak factor estimation of non-Gaussian wind pressure on high-rise buildings[J/OL]. The Structural Design of Tall and Special Buildings, 2017: e1386[2023-09-22]. https://sci-hubtw.hkvisa.net/10.1002/tal.1386.
[14] JOHNSON N L. Systems of frequency curves generated by methods of translation[J/OL]. Biometrika, 1949, 36(1/2): 149-176[2023-09-22]. https://sci-hubtw.hkvisa.net/10.1093/biomet/36.1-2.149
[15] GAVANSKI E, GURLEY K R, KOPP G A. Uncertainties in the estimation of local peak pressures on low-rise buildings by using the Gumbel distribution fitting approach[J/OL]. Journal of Structural Engineering, 2016, 142(11): 04016106[2023-09-22]. https://sci-hubtw.hkvisa.net/10.1061/(asce)st.1943-541x.0001556.
[16] PENG X L, YANG L P, GAVANSKI E, et al. A comparison of methods to estimate peak wind loads on buildings [J]. Journal of Wind Engineering and Industrial Aerodynamics, 2014, 126(1): 11-23.
[17] 林强, 刘敏, 杨庆山, 等. 非高斯风荷载峰值因子估计: 基于矩的转换过程法的对比研究[J]. 工程力学, 2020, 37(4): 78-86. LIN Q, LIU M, YANG Q S, et al. A comparative study on moment-based translation process methods for the peak factor estimation of non-gaussian wind pressures [J]. Engineering Mechanics, 2020, 37(4): 78-86. (in Chinese)
[18] KAREEM A, ZHAO J. Analysis of non-gaussian surge response of tension leg platforms under wind loads [J]. Journal of Offshore Mechanics and Arctic Engineering, 1994, 146(3): 137-144.
[19] WINTERSTEIN S R, MACKENZIE C A. Extremes of nonlinear vibration: comparing models based on moments, L-moments, and maximum entropy[J/OL]. Journal of Offshore Mechanics and Arctic Engineering, 2013, 135(2): 021602[2023-09-22]. https://sci-hubtw.hkvisa.net/10.1115/1.4007050.
[20] KWON D, KAREEM A. Peak factors for non-Gaussian load effects revisited [J]. Journal of Engineering Mechanics, 2011, 137(12): 1611-1619.
[21] YANG L, GURLEY K R, PREVATT D O. Probabilistic modeling of wind pressure on low-rise buildings [J]. Journal of Wind Engineering and Industrial Aerodynamics, 2013, 114: 18-26.
[22] LIU M, CHEN X Z, YANG Q S. Estimation of peak factor of non-Gaussian wind pressures by improved moment-based Hermite model[J/OL]. Journal of Engineering Mechanics, 2017, 143(7): 06017006[2023-09-22]. https://sci-hubtw.hkvisa.net/10.1061/(asce)em.1943-7889.0001233.
[23] HUANG G Q, JI X W, ZHENG H T, et al. Uncertainty of peak value of non-gaussian wind load effect: analytical approach[J/OL]. Journal of Engineering Mechanics, 2017, 144(2): 04017172[2023-09-22]. https://ascelibrary.org/doi/full/10.1061/%28ASCE%29EM.1943-7889.0001402.
[24] HUANG G Q, LUO Y, YANG Q S, et al. A semi-analytical formula for estimating peak wind load effects based on Hermite polynomial model [J]. Engineering Structures, 2017, 152: 856-864.
[25] RICE S O. Mathematical analysis of random noise [J]. Bell Labs Technical Journal, 1944, 23(3): 282-332.
[26] 中国工程建设标准化协会. 建筑结构荷载规范: GB 50009—2012[S]. 北京: 中国建筑工业出版社, 2012. [27] American Society of Civil Engineers. Minimum design loads for buildings and other structures [S]. Reston, Virginia: American Society of Civil Engineers (ASCE), 2013.
-
期刊类型引用(1)
1. 吴罗成,张龙文,曾梦澜. 线性矩法在分布未知条件下的随机结构抗震可靠度分析. 振动工程学报. 2025(01): 180-190 .  百度学术
百度学术
其他类型引用(0)


 下载:
下载:
